lunes, 25 de septiembre de 2017

The Best Story Maps of the Year

Esri Storytelling with Maps Contest Winners Share Their Notable Creations

By Allen Carroll
Program Manager, Storytelling, Esri
Daniel Coe delved into an interesting topic for his story map: flooding during the ice age that carved out unique features in the State of Washington.
The prizewinning entries in this year's Esri Storytelling with Maps Contest reflect a happy trend: as the community of story map authors has grown, the quality of the stories they produce has notably improved. That is evident after even a quick look at this year's winning story maps, which tackled topics that included prehistoric floods in Washington state, a wild rickshaw ride across India, and a solemn remembrance of a concentration camp in Poland.
The highest honors went to Daniel Coe, of the State of Washington Geological Survey, who won the grand prize for Washington's Ice Age Floods and an additional award for Native Trees of the Pacific Northwest: A Geographic Guide, which he created in his free time. You might call it beginner's luck, as these were the first two story maps Coe ever made. But after speaking with Coe about his creations, we discovered there was a lot of skill behind the luck.
The Ice Age Floods National Geologic Trail celebrates the natural history of the landscape created by the flooding that occurred more than 12,000 years ago.
Perhaps the secret of Coe's success is in his background, which combines art and geography. "I've always been kind of addicted to travel, and I can stare at a road atlas for five hours," he said. "That, combined with liking to draw and paint, naturally led me to cartography." Coe attended the Art Institute of Pittsburgh in Pennsylvania in the late 1990s and later earned a geography degree from Portland State University in Oregon.
Washington's Ice Age Floods reconstructs the vast floods that, 15,000 years ago, swept across what is now Washington state. Using the Esri Story Map Cascadeapp, he combined photos, video, animations, lidar imagery, and beautiful cartography to dramatically depict the sequence of events that left deep scars on the landscape, including the Channeled Scablands of southeast Washington.
Coe created an informative guide about trees using an Esri story map.
Coe won second place in the contest's Science, Technology, and Education category for his Native Trees of the Pacific Northwest guide, which he created using the Esri Story Map Journal app. "[The project] started off as my wanting to learn [how to use] the app," Coe said.
An accomplished amateur photographer, Coe already had an extensive collection of forest photographs. He used a series of tree range shapefiles from the United States Geological Survey (USGS), from which he produced a series of handsome web maps. Coe spent time in the field photographing additional trees to fill out his collection. His seemingly informal project turned into a six-month effort.
Since Coe created the Washington's Ice Age Floods story map as a function of his job for the State of Washington, he will bring the prizes—a 3DR Solo Drone; a one-year, one-user Drone2Map for ArcGIS license; and the GoPro HERO4 Silver edition camera—back to his organization.
The story map Putting Park Back in Parkway details the vision and plans for the Sir John A. Macdonald Riverfront Park in Ottawa, Canada.
This year's Esri Storytelling with Maps Contest attracted more than 750 entries from a wide array of individuals and organizations, including municipal governments, state agencies, nonprofits, and educational institutions. Although the number of entries was comparable to last year's contest, it was not the quantity but the quality of the finalists' story maps that made judging challenging.
The story maps team convened for two rounds of preliminary judging, winnowing the entries to a few dozen finalists. Despite the improvement in overall quality, many story maps were quickly eliminated during judging because of relatively basic errors and oversights, such as map pop-ups that hadn't been configured or images or map elements that weren't shared publicly, making some of the content in the story map or even the entire story map inaccessible.
The Counsells had planned to take a direct route from Jaisalmer to Kochi in India.
Here's some advice for aspiring story map authors: peruse the ArcGIS blog for tips on how to make your story map effective. This instructional story map, called 13 Ways to Make Your Story Map Sing, gives some basic, helpful advice.
The final round of judging was done by a panel of journalists with expertise in mapping and graphics, including John Duchneskie, assistant managing editor for design and graphics at the Philadelphia Inquirer; David Dudley, interim editor at CityLab; and David Mellnik, database editor at the Washington Post. [Editor's note: Carroll also helped with the judging, tapping into his experience as former chief cartographer at National Geographic.]
The Esri Storytelling with Maps Contest honored Coe and 13 other winners and three honorable mentions, including the following:
Polish students Anna Kurylowicz and Marzena Koziak used historical photos, imagery, and maps to tell the story of the Płaszów concentration camp.
  • The National Capital Commission in Canada won first prize in the Infrastructure, Planning, and Government category for Putting Park Back in Parkway, which uses the Esri Story Map Cascade app to inform the citizens of Ottawa, Canada, about the Sir John A. Macdonald Riverfront Park Plan. The story map skillfully combines archival and current photography with static and dynamic maps to present a plan to enhance a greenway along the Ottawa River.
  • Chris Counsell of Australia won first prize in the Travel, Destinations, and Recreation category for The Rickshaw Run, an entertaining account of an offbeat adventure in India. Counsell and his brother, Will, persuaded their father to celebrate his 60th birthday with a 3,000-kilometer rickshaw ride across India. The Rickshaw Run features a series of full-screen video clips that give viewers a vivid, you-are-there sense of the men's sometimes hilarious misadventures.
  • The University of Minnesota Institute on the Environment's insightful story map, Diverse Farms, Diverse Foods: Farm Size and Nutrient Diversity, placed first in the Conservation, Environment, and Sustainability category. The institute conducts important research on world agriculture and food supply issues. This is the organization's first story map and demonstrates the authors' skill at communicating their research through vivid maps, photographs, infographics, and satellite imagery.
  • Anna Kurylowicz and Marzena Koziak, of the AGH University of Science and Technology in Poland, won first prize in the Culture, History, and Events category for their story map, The Cruel Reality. The story map tells the history of Płaszów, a German concentration camp in Cracow, Poland. It places a detailed map—of the long-destroyed concentration camp—atop a modern aerial photograph of an apparently innocuous landscape in Cracow. The Cruel Reality locates and identifies the camp's buildings while describing how prisoners were forced into labor: quarrying limestone, making uniforms for SS officers, and working in factories. Some 8,000 prisoners died during the camp's yearlong existence. The story map superbly demonstrates the power of maps to bring history to life, preserving the memory of a dark past.
  • Downtown Reborn, by Kevin Howard, Leslie Fletcher, M. J. Simpson, Scott Aulen, and Scott Bachman of the City of Greenville, South Carolina, won second prize in the Infrastructure, Planning, and Government category. The story map illustrates how downtown Greenville has gone from floundering to thriving over the past 40 years. Viewers can scroll through time to see how a multitude of forces fostered the veritable transformation.
View the complete list of the 2017 Esri Storytelling with Maps Contest winners.

Esri Coursebooks Go Digital

Esri Coursebooks Go Digital

Printed Workbooks Shelved in Favor of Digital Versions with Color Maps and Other Materials

By Suzanne Boden
Esri Training Services
Esri Training continues its digital transformation with a new initiative: starting this month, students will receive only digital workbooks in Esri training center classes.
Gone are the printed coursebooks that Esri has supplied over the last 30 years for students who attend traditional instructor-led classes. Digital workbooks offer several benefits over print versions including the following:
  • Color—For years, one of the enhancements most frequently requested by students has been to replace black-and-white coursebooks with color books. When you work with maps, you want to see them in color, of course. However, producing thousands of printed color coursebooks every year is expensive. With digital books, Esri Training can finally provide the color materials that many of you have wanted for years.
  • Productivity tools—Printed books are wonderful to hold and flip through, but digital books have great features too. For example, you can use provided bookmarks to jump directly to lesson pages, and you can quickly search the content for specific words and phrases. You can also highlight text and add digital notes. That makes it easy to find the information you need after class when you're trying to remember the steps to complete an ArcGIS task or workflow.
  • Up-to-date materials—In the past, Esri software releases occurred every couple of years. Today, releases happen quarterly. This cycle is great for providing new and improved functionality to Esri's customers, but it makes keeping training materials up-to-date very challenging. With digital books, Esri will be able to update content much faster.
  • Reduced environmental footprint—As a company committed to sustainability and smart planning, Esri feels a responsibility to conserve resources wherever possible. Digital books significantly reduce paper use and the energy and chemicals required by the printing process. Digital books also eliminate the fuel usage associated with shipping printed books to each Esri training location.
  • Cost savings—Recognizing that many organizations have limited training budgets, Esri strives to offer affordable, competitively priced products. Adopting digital coursebooks will produce savings that will help keep the cost of instructor-led training as low as possible.
Digital coursebooks provide rich color and convenient tools for students in Esri instructor-led classes.
There are more than 400 e-Learning resources in the Esri Training catalog.
Esri training center classrooms will feature dual-monitor workstations for each student.
Digital coursebooks are the latest in a long line of digital moves for Esri Training. In 1997, Esri launched Esri Virtual Campus, one of the first commercial websites devoted to teaching GIS topics and technology on the web. Web courses were a relatively new phenomenon in the late 1990s but quickly gained a following, especially in the higher education community.
Virtual Campus web courses were so popular that Esri decided to virtualize the in-person seminar experience. In 2001, live training seminars were launched. These are hour-long, free, online seminars on technical topics. Those also proved to be—and remain—popular.
The instructor-led online classroom was introduced in 2004. Shortly afterward, the Great Recession hit, and many GIS professionals found themselves grounded, unable to travel to attend a training class. For several years, the online classroom was the only viable option for many Esri customers to attend instructor-led training. Today, the online classroom is just as popular as Esri's traditional classrooms.
In 2016, the Esri Training website was redesigned, doubling the size of the e-Learning collection to include new formats and durations.
So digital is already a huge part of what Esri does. Plus, online classroom students have always received digital course workbooks. Their feedback has helped us understand which digital features are most valuable, both during class and afterward, back at the office.

The Digital Dimension

To ensure that students continue to have an excellent classroom experience, Esri is adding a second monitor to each classroom workspace. Students will view the digital coursebook on one monitor while following the course presentation and interacting with Esri software on the other monitor.
At the beginning of class, students will download the digital coursebook from the Training website and annotate it as desired throughout the class. At the end of class, students will upload their annotated coursebooks to the Training website. Back at the office, the coursebook can be downloaded to a local drive and easily referenced at any time.

lunes, 4 de septiembre de 2017

The Many Faces of Today´s Web GIS


The Many Faces of Today´s Web GIS


 0
Today´s GIS technology differs dramatically from “old school” GIS. But only recently did GIS truly become web GIS, with web APIs and programming languages enabling the use of geospatial technology that surpasses separate desktop applications. Here are some major differences between “old” and “new” GIS.

1. Today, GIS is more than cartography

The first-generation GIS products focused heavily on cartography. GIS was foremost an application for producing good-looking paper maps and doing spatial analysis with the underlying data. The next-generation GIS applications (such as ArcGIS Pro) are slightly different in that they offer a project-based approach, meaning that a map is just one part of the puzzle. A map is no longer the final destination, but can be the starting point for further analysis in a larger trajectory. GIS itself be a tool among a set of different tools to solve real life problems.

2. GIS now requires collaboration

GIS used to be a one-man show. It was used on a separate machine with a separate GIS license, and operated by a skilled cartographer or GIS analyst. Today´s GIS workforce needs to collaborate with other GIS users while working simultaneously on mapping projects. Furthermore GIS is more and more a standard requirement in web development jobs in industries that have no previous engagement with GIS technology. This shows that GIS technology is becoming less of a niche industry.

3. Today´s GIS is all about communities

The use of social media, community efforts such as GitHub, Geonet or StackExchange.com show how GIS users are connected and use their knowledge to help the community forward as a whole.
Meanwhile, a new product such as ArcGIS Hub helps different end users in launching new community-based mapping initiatives. And let´s not forget the many regional, national and international geospatial events that bring together different GIS users and share their work. With more and more geospatial technology available, it´s impossible to learn every single tool that´s on the market—It´s best to specialize and focus on a set of topics or applications and participate in a community that represents it.

4. Coding and GIS are now inseparable

Although programming languages extend current geospatial technology, they are not meant as a replacement for it. A few years ago, the Python language was introduced for the ArcGIS Desktop application to offer scripting and application development capabilities. Although widely adopted, the ArcPy site package feels like a small work compared to the new Python API for ArcGIS, which greatly exceeds ArcPy in terms of functionality. Combined with open source tools such as the SciPy stack, Jupyter Notebooks, and the Anaconda package manager, today´s GIS users have a great set of tools at their disposal to greatly enhance their current workflows.
A second interesting consequence of this adoption of programming languages by GIS vendors is that web developers can adopt GIS technology in a way they understand: through web APIs and programming languages. In addition to web developers adopting GIS, the GIS community has adopted JavaScript, Python, and R. This creates interesting opportunities for both communities.

5. Desktop GIS has become a part of Web GIS

In 2005, Google Maps offered accessible, easy to manage, and free geospatial technology over the web. At that time, the GIS industry was still figuring out how to incorporate web technology. Over time, Google focused more on the consumer market than the professional geospatial market, but in the meantime the GIS industry learned some valuable lessons. Technologies used by Google, including mobile, cloud computing, big data analytics, data science, and business intelligence have all left their marks on the evolution of geospatial technology, resulting in a cloud infrastructure that is now inextricably linked to all local GIS use. It is possible to access cloud GIS components through a web browser and do geospatial analysis using the Python programming language.
This is still GIS, although you´re not using a standalone application as in the old days. It shows how GIS technology is becoming ubiquitous.

Put Bookmarks to Work in Your ArcGIS Pro Projects

Put Bookmarks to Work in Your ArcGIS Pro Projects

By Hannah Deindorfer
Documentation Project Engineer, Esri

You likely have a browser full of bookmarked web pages, making the information you most often need to retrieve right at your fingertips.
Bookmarks can be just as helpful when used in ArcGIS Pro. There are some cool tools in ArcGIS Pro that will give you the ability to convert bookmarks to animations and create bookmarks at certain points in time.
Bookmarks will save you precious time when you are working on a project. You can create spatial bookmarks at locations on a map and go back to them at any time. For example, if you have a large map and several small study areas on the map, you can save time panning and zooming to those areas by creating a bookmark at each location. Or if you are giving a presentation with ArcGIS Pro (like a demo), bookmarks come in very handy for saving your place and transitioning smoothly between places on the map.
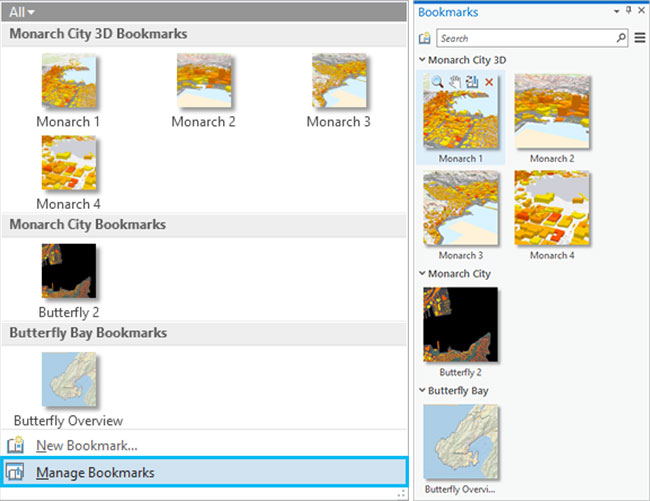
The bookmark captures and saves your current view extent. When you create a bookmark in ArcGIS Pro, it is added to a list, given a unique thumbnail and name, and saved with the 2D map or 3D scene you captured it in. A project contains a list of all the bookmarks saved with all open maps in that project.
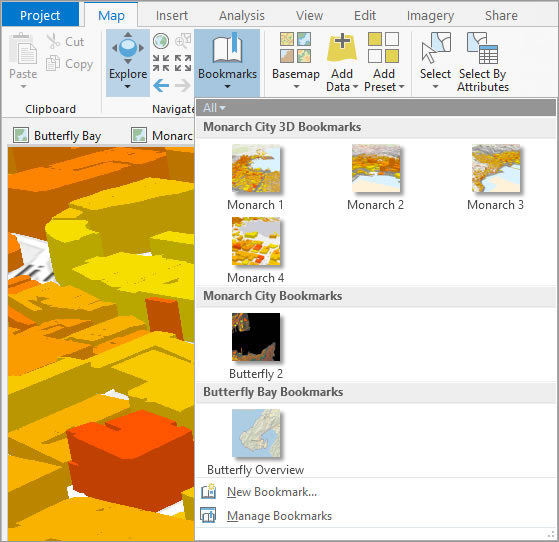
Use bookmarks to save your favorite or frequently used map extents. They're stored with a title and thumbnail on the Bookmarks drop-down menu.
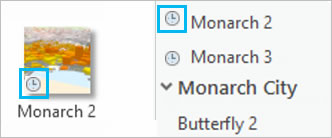
In ArcGIS Pro, bookmarks can also be temporal. If you have time-enabled data, you can create bookmarks at specific points in time. For example, if you have data that tracks the migration of monarch butterflies across North America, you can create a bookmark showing the butterflies' location midmigration and return to it anytime. Temporal bookmarks display with a clock icon that appears both in the thumbnail and next to the bookmark name in a list view.

Create and use bookmarks

Step 1. Pan or zoom to the location or time that you want to bookmark.
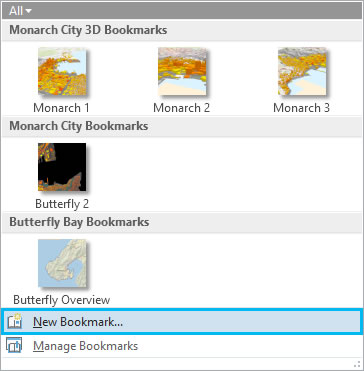
Step 2. On the Map tab, click the Bookmarks drop-down menu, and click New Bookmark.
Step 3. Type a name for your bookmark, then click OK.
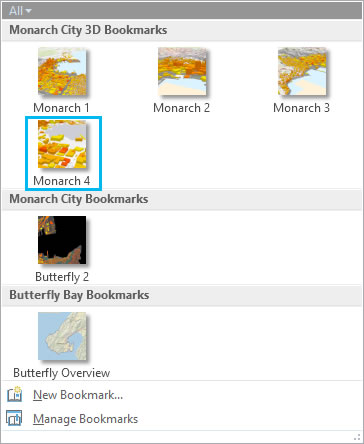
Step 4. Click the Bookmarks button to see your new bookmark and other bookmarks you've created in that map or other open maps in the project.
Step 5. Click any of the thumbnails on the Bookmarks menu to go to that location.

Use the Bookmark Manager

If you want to modify your bookmarks, open the Bookmarks pane. On the Map tab, click the Bookmarks drop-down menu and click Manage Bookmarks.
In the Bookmarks pane, you can do any of the following:
  • Reorganize your bookmarks list
  • Update the location of a bookmark by clicking the Update button
  • Create new bookmarks
  • Rename or delete bookmarks

Create an animation with bookmarks

Animations are a great way to tell the story of your 2D and 3D maps. Check out this awesome video of animations to quickly see how powerful they can be in displaying and conveying information.
You can use your bookmarks to create an animation.
  1. On the ribbon, click the View tab and click Add to access the Animation tab.
  2. In the Create group, click Import and choose Bookmarks to Fly-Through or Bookmarks to Tour.
Watch this short video on how to convert bookmarks to animation.

Sea Turtle App Turns Tourists into Citizen Scientists

Sea Turtle App Turns Tourists into Citizen Scientists

Researcher Easily Built His First App by Using AppStudio for ArcGIS


A sea turtle swims past schools of fish.
Snorkelers, scuba divers, and beachgoers who spot sea turtles can help scientific researchers learn more about the elusive and often endangered marine reptiles.
All they need to do is download an app called TURT (Turtles Uniting Researchers and Tourists) onto their smartphone before they hit the beach or go out on the water. The app is available on iOS and Android.
Dustin Baumbach, a PhD student and marine researcher at Loma Linda University in California, built TURT using AppStudio for ArcGIS, which Esri developed to help users create mobile mapping apps quickly. The mapped data from TURT is available for sea turtle research, including the work being done by the non-profit Protective Turtle Ecology Center for Training, Outreach and Research, Inc., (ProTECTOR).
"Data uploaded by scientists and citizen scientists [will] help our research by mapping out locations of turtles to help us track population numbers within countries and, through the help of photo identification (photo ID), track individuals on a global scale," Baumbach said.
Loma Linda University PhD student and researcher Dustin Baumbach used AppStudio for ArcGIS to build TURT.
The TURT app lets you map the location of your sea turtle sighting.
Today in places such as the US Virgin Islands, Honduras, and Hawaii, sea turtles can frequently be spotted swimming along ocean currents or crawling onto beaches to lay their eggs.
When TURT app users see a sea turtle, they can snap a photo of the marine reptile; add its location on a map; choose from a list to indicate the type of turtle—for example, Hawksbill, Loggerhead, or Olive Ridley—they spotted; and type in some details such as the weather conditions, depth of the ocean, and time of day and date of the sighting.
Baumbach photographs a sea turtle in the ocean off Honduras. Photo by Dr. Floyd Hayes.
Once data is added to the TURT app, it is automatically and instantaneously uploaded to a global sea turtle database via a web map stored in Esri ArcGIS Online. Researchers and conservationists use the information to analyze trends and hot spots to assess the distribution, health, and migration activities of the various sea turtle species.
TURT turns tourists into citizen scientists, reporting on creatures that have cruised the oceans for 100 million years. The information people collect is important, because nearly all the seven species of marine reptiles are now classified as endangered, according to the National Oceanic and Atmospheric Administration (NOAA).
Baumbach worked on the TURT project with Stephen Dunbar, a professor in the Loma Linda University School of Medicine's department of earth and biological sciences. Dunbar has been studying sea turtles for 10 years in places such as the Caribbean Sea and Honduras. Baumbach joined Dunbar in his research for two summers, which prompted the idea for a smartphone app that would assist sea turtle conservation researchers.
"Researchers are not able to be at their field site all year long, but divers are there every day," Baumbach said. "Sea turtles are a critically endangered species, and this app can help conserve them while also educating other researchers and the public."
The app lets you select the species of turtle that you spotted.
Once information is uploaded to the TURT app, it is automatically and instantaneously inserted into a global sea turtle database.
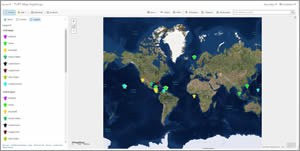
A map is available to ArcGIS Online users that shows all the turtle sightings collected by the app's users.
This map, available to view in ArcGIS Online, shows the sea turtle species and locations of sightings that have been documented by the TURT app users around the world.
To build TURT, Baumbach selected AppStudio for ArcGIS because it allowed him to create a consumer-friendly mobile app that works with Android, iOS, Windows, Mac OS X, and Linux. The app can be used in offline mode, so divers in remote areas without cell phone coverage can still record sightings. Moreover, using AppStudio for ArcGIS let Baumbach publish TURT in app stores, using his own brand. In this case, he employed branding from ProTECTOR, Dunbar's nonprofit organization.
"I had never made an app before, but AppStudio was very simple to use," Baumbach said. "I downloaded the app, put all my info into the Quick Report template, and then customized it using the AppStudio language. Being able to deploy the app across platforms is a big benefit. And it's good that we can brand it through our organization."
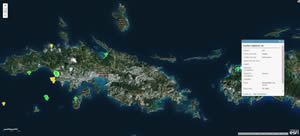
A pop-up provides details of a sea turtle sighting on the island of Saint John, U.S. Virgin Islands.
Baumbach and Dunbar have started promoting the app to dive operators around the world, with a focus on the Caribbean, Thailand, Malaysia, Australia, and Indonesia, since those are places where people have already started uploading sightings. Additionally, the app allows users to map places where sea turtle products, such as souvenirs made from their shells or sea turtle meat, are being sold and thus help curb these illegal dealings.
"We are able to track the locations where turtle products are being sold so that we can work with local governments to stop this illegal trade," Baumbach said.
The TURT app is free and can be found in the Apple and Google Play app stores.