martes, 12 de diciembre de 2017

What's New in ArcGIS API for JavaScript

ArcGIS API for JavaScript versions 4.5 and 3.22 released

Version 4.5 of the ArcGIS API for JavaScript adds some key capabilities and several smaller (but sweet) enhancements that will come in handy. Here are the highlights in 4.5 (as well as 3.22); a full overview detailing new features can be found in the release notes.

Fast feature layers: Interact with more than a million features

Now you can display more data and dynamically visualize features more rapidly, such as this layer with more than 1 million building footprints. This is achieved by enabling the WebGL option (beta) now available for FeatureLayers in a 2D map.
FeatureLayer will be rendered with WebGL by default in a future release.

Drawing: it’s here!

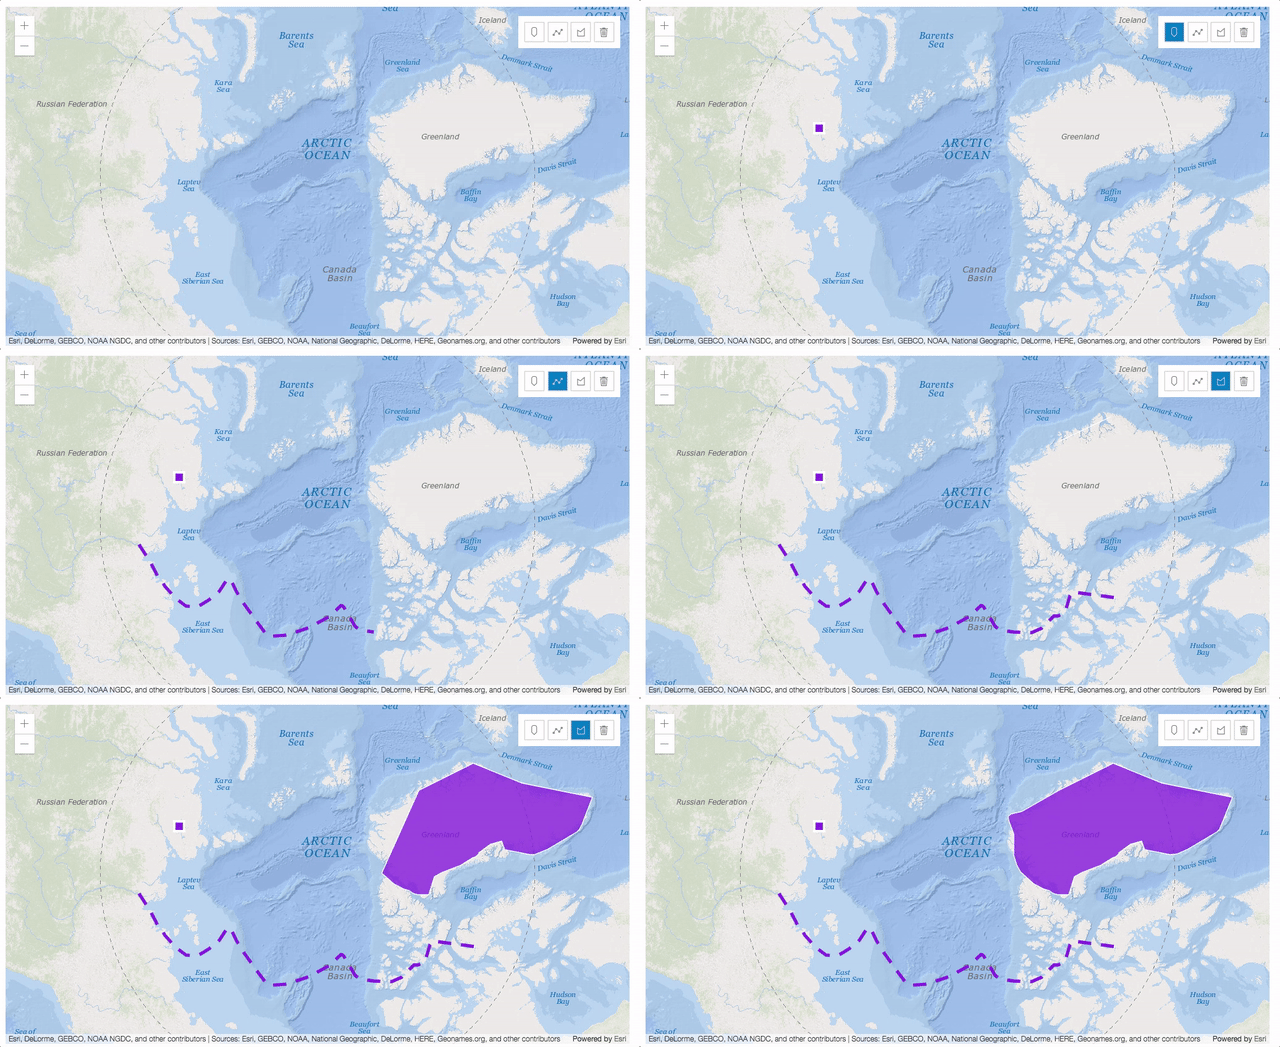
You now can enable drawing in your 4.x apps. In this initial release of sketching tools, you can sketch new geometries in a 2D map. Full support for drawing and editing will become available incrementally in future releases, which will include the following:
  • Editing existing geometries
  • Creating and editing new geometries including (but not limited to) multipoint geometries.
  • Sketching/editing widgets
  • Support for drawing in a 3D Scene
  • Full editing support, including the ability to enable common geometry validation rules, such as preventing self intersecting lines.
Check out this new sketching sample and play around with the current capabilities.

OGC enhancements

WMS and WMTS layers can now be visualized in a 3D scene. Also, KML support has been added for 2D maps. Support for KML in 3D scenes will be available in a future release.

New options for vertical placement of 3D objects

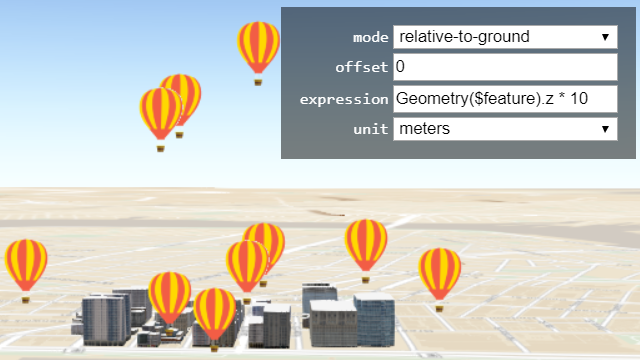
The vertical placement of buildings and other 3D Objects can be set using a field value, z-value, or an expression. An example of when this would be useful is when placing objects that are either below ground or are flying above ground.

Clustering with version 3.22

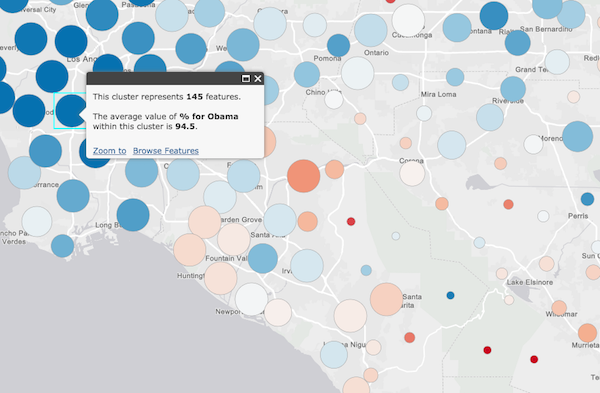
If your map has a layer with a large number of points, configuring point clustering makes it easier to visually extract information from your data. When you enable clustering, point features within a certain distance are grouped into one symbol. You can enable clustering in your JavaScript app using either of the following methods:
Clustering is currently only available in version 3.22, but will be added to 4.x in early 2018. This blog discusses how clustering enables data exploration.

There’s more…

Explore the release notes and new samples to learn about more updates such as support for vertical coordinate systems, pop-up improvements, and time-saving enhancements such as expanded autocasting support.
This entry was posted in App DevelopersDeveloperWeb and tagged . Bookmark the permalink.

Médico colombiano gana Geospatial Events Grant UNIGIS

Médico colombiano gana Geospatial Events Grant UNIGIS

Por su tesis sobre "Identificación de patrones de distribución espacial de criaderos de Aedes Aegypti en Cali-Colombia, usando Sistemas de Información Geográfica (SIG)", el médico epidemiólogo Oscar Oliver Londoño Agudelo recibió una beca UNIGIS Geospatial Events Grant (GEG), otorgada a partir del 2017 por la Junta directiva de UNIGIS Internacional y socios de la industria.

Los GEG cumplen como objetivo conectar a los estudiantes UNIGIS activos con la comunidad geoespacial internacional y crear valor agregado dentro de la misma red UNIGIS, más allá de lo académico. El médico colombiano actualmente candidato a la MSc GIS de UNIGIS, certificada por la Universität Salzburg y adscrito a la Secretaría de Salud de Santiago de Cali, abordó como trabajo de grado la problemática del control del Aedes Aegypti, mosquito transmisor de enfermedades tropicales como el dengue, Chikungunya y Zika.  Su estudio propone el uso de herramientas de análisis espacial para determinar la ubicación de áreas proclives de criaderos de Aedes Aegypti en zonas urbanas de la ciudad de Cali-Colombia, y así focalizar acciones de control que puedan resultar más eficaces.

La investigación fue realizada en dos zonas con población de entre 15 mil y 35 mil habitantes con distancia entre si de al menos 4 kilómetros. Se analizó también datos de sumideros de aguas lluvias a lo largo de un periodo, considerando su papel fundamental como reservorio del mosquito y su estrecha relación con los ciclos de lluvias. Los hallazgos de la investigación permitirán al sector salud replantear estrategias de intervención ya que con 5 a 10% de los recursos destinados a examinar las viviendas en una zona, podrían identificarse los focos donde la intervención es más efectiva, evitando así la dispersión de recursos y alcanzando el objetivo en un tiempo menor.

La beca subvención permitirá al ganador presentar los avances de su investigación en el Esri Health and Human Services GIS Conference, que tendrá lugar en octubre de 2018 en Redlands, CA, USA 

La comunidad UNIGIS hace extensiva la felicitación al Dr. Oscar Londoño y se enorgullece por el logro científico alcanzado a partir de la usabilidad de los SIG.

Le invitamos también a participar del Foro mundo UNIGIS 2017 desde el nodo de su preferencia ¡Bienvenidos!

"Creamos la Comunidad SIG más activa en América Latina".
===================
Síganos en las redes

https://twitter.com/UnigisALatina     

Relive Outdoor Adventures with a New App and Esri Maps

App Lets Outdoor Adventurers Relive Their Experiences Using 3D Videos with Esri Maps

3D Virtual Tours of Cycling Trips and Runs Come Alive on Esri World Imagery Basemaps

By Jessica Wyland
Esri Writer
and Carla Wheeler
ArcWatch Editor
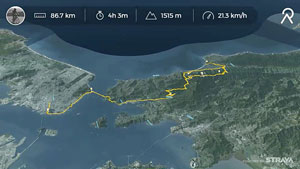
An image from this Relive video shows the route taken during a cycling trip in San Francisco, California.
Are you a cyclist or runner who wants to relive your athletic adventures or share the experience with friends, relatives, or the public? Thanks to a new, free app from a Netherlands-based company, your rides and runs can now be shared via virtual 3D video tours that display the route you took on an Esri World Imagery basemap.
The Relive app combines performance tracking data from cyclists or runners with Esri digital maps and makes a short animation video in 3D that shows about a minute's worth of highlights of the athlete's treks. The animation includes the route traced in yellow on the basemap, metrics such as terrain elevation and the length and average speed of the ride or run, and popups with photographs that were taken during the activity.
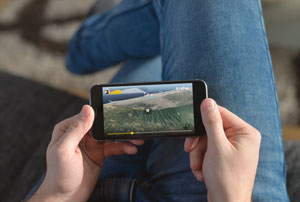
You can watch your cycling, running, or hiking videos on mobile devices.
The app was developed by the startup Relive, which creates 3D video stories of bike rides and runs using GPS data collected from its users' tracker apps, such as Garmin Connect and Strava, and their personal photographs. Relive currently has 1.2 million users around the world.
"People love to share [the videos] with their family and friends," said Joris van Kruijssen, who cofounded Relive with developers Lex Daniels and Yousef El-Dardiry.
Daniels, van Kruijssen, and El-Dardiry came up with the idea for the Relive app during a bike trip in the Canary Islands in 2016. "We were cycling in Tenerife and figured it would be amazing if there was an app to capture our cycling holiday in a movie," said El-Dardiry, who is also Relive's technical lead.
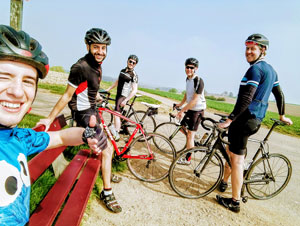
The Relive team includes (from left to right) Ralf Nieuwenhuizen, Yousef El-Dardiry, Joris van Kruijssen, Ronald Steen, and Lex Daniels. Not pictured are Thomas Meijers and Jochem Lugtenburg.
While van Kruijssen, Daniels, and El-Dardiry were using the Strava app to record performance metrics on their rides in Tenerife, the three friends realized something was missing: the visual aspect of their adventures. "It didn't fully capture the experience we had—the nice views, discovering the terrain, and the fun we had. We saw a great opportunity," van Kruijssen said.
Talk soon turned to action. After fleshing out the idea during a barbecue in Tenerife, Daniels and El-Dardiry began writing code, and the app started to take shape later the same day.
Back home in the Netherlands, they created what van Kruijssen called "a good working prototype" within two months and shared it with a few friends. "After a week, a thousand people were using our app," he said.
Today, Relive employs a team of seven people and continues to refine its mobile app, available for download from Google Play or the Apple App Store. The app takes activity-tracking data from apps such as Strava, Garmin Connect,  Endomondo, and Polar Flow  and maps it on satellite imagery from the World Imagery basemap, which Relive obtained from Esri Netherlands.  (Users who sign up for Relive accounts give Polar Flow, Endomondo, Strava, and Garmin Connect permission to share their data with the Relive app.)
During the app development phase, El-Dardiry searched for digital map technology to visualize the adventures. He found Esri's World Imagery basemap in the Living Atlas of the World to be a great fit with the app.
An image from this video displays statistics about a cycling trip, including the distance ridden in kilometers and how long the ride took in hours and minutes.
"We wanted to give everyone the opportunity to create a beautiful video of their adventures, so it was important to find a high-quality map with global coverage," said El-Dardiry. "Esri's Living Atlas of the World was the best solution. And the involvement of Esri is great. They understand the unique needs and challenges of our startup and are always thinking of how they can help us."
During a recent trip to San Francisco, California, van Kruijssen, an avid bike rider, said he tracked his performance metrics as he cycled across the Golden Gate Bridge to Marin County. Within a half hour after his trip, he had used the Relive app to create a video of the journey to send to his mother in the Netherlands. "I immediately shared it with my mom to show her what great views I had," he said.
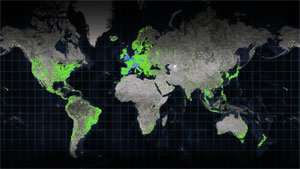
This map, created by Relive and Esri Netherlands, shows where cycling, running, and hiking videos have been made globally. Green symbolizes cycling, blue symbolizes running, and purple symbolizes hiking.
Relive is already a success, with more than 200,000 new videos being made each day around the world including from countries such as South Korea and Brazil. The company recently launched a premium service for paying members called Relive Club, which lets users do more with their videos such as add music.
Maps, however, are a staple in the app. And because Esri's digital maps are scalable, the Relive founders feel confident that their company can continue to grow.
"Every adventure starts with a map," El-Dardiry said. "We want to provide people with the opportunity to relive their adventures, whether they're cycling, hiking, running, skiing, or going on a road trip. It's great to see our idea spread globally…and it's just the beginning of our adventure."
Watch the video of a cycling trip created with the app or make your own virtual tour at Relive.

Navigate with Ease

Navigate with Ease

Plan a Route in ArcGIS Online and Use It in Navigator for ArcGIS

By Scott Sandusky
Product Manager, Esri
ArcGIS provides many tools for routing and transportation network analysis. Once this routing and analysis is completed in the office (say, in ArcGIS Pro or ArcGIS Online), then what? How do you get the resultant stop list to your field crew to operationalize and drive?
Answer: The route layer.
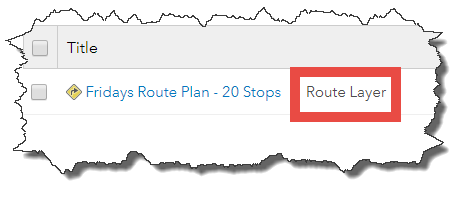
A route layer is an item type within ArcGIS Online. Route layers can be created from the ArcGIS Online Directions pane and by using the ArcGIS Online tools with network analysis capabilities: Find NearestPlan Routes, and Connect Origins to Destinations.
(In the future, ArcGIS Pro 2.1 and ArcGIS Enterprise 10.6 will be able to save network analysis results as route layers.)
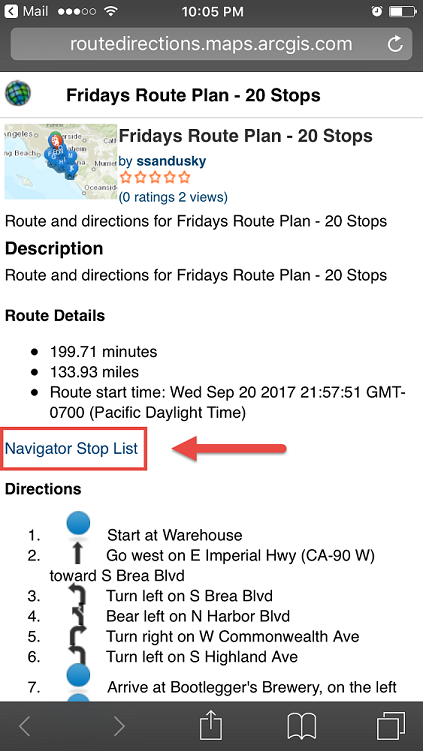
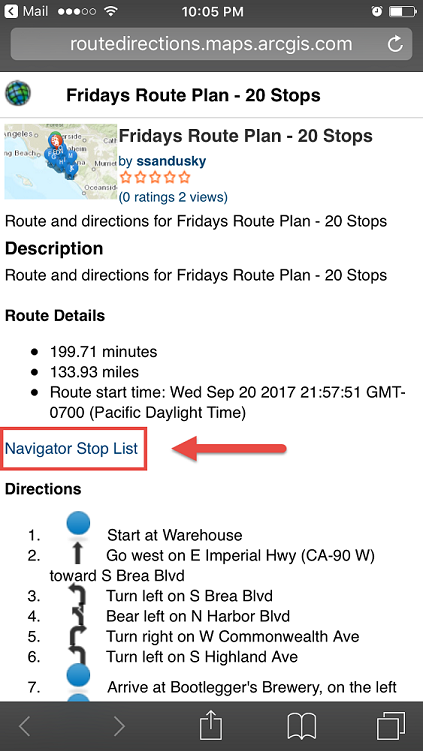
You can then view the route layer item on your mobile device and click the Navigator Stop List link. This automatically loads all your route's stops into Navigator for ArcGIS.
How do you get this route layer item onto your device? You have a few options. First, you can paste the URL into an email and send it to yourself or someone else. Another option is to create a shortcut on your mobile device to a group that these route layers are always shared with.
Here's how to do this:
Step One: Create a route.
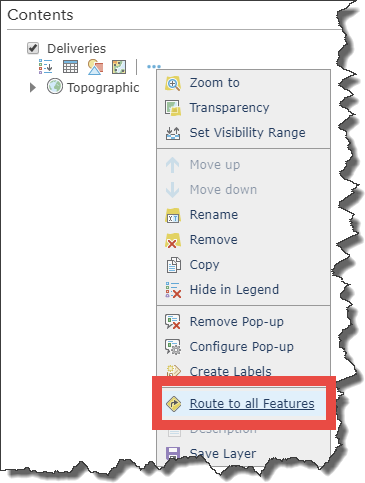
Using the Directions pane, build a route. Refer to the Directions pane help documentation for details.
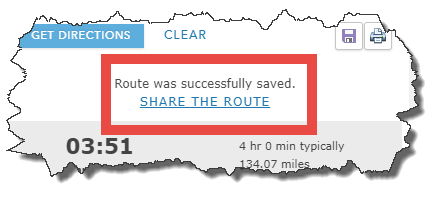
Step Two: Save your route.
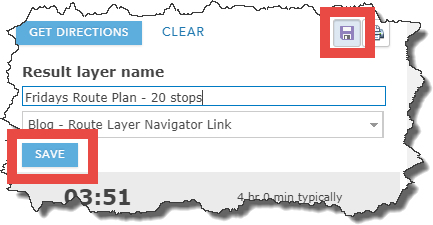
Give your route a useful name and store it in a folder so that you know where to find it.
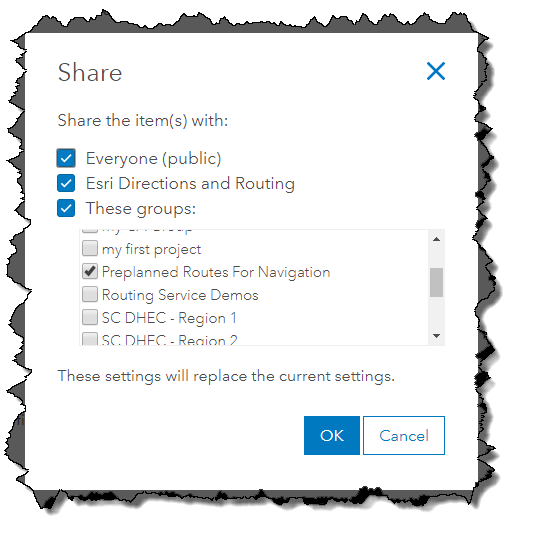
Step Three: Share your route.
The SHARE THE ROUTE link takes you to the route layer item details page where you can choose to share the route with everyone, your organization, or a specific group in your organization. For this example, we've shared the route publicly (so it's available to you) and with a dedicated group for fieldworkers (to show how a group can be used within your organization).
Step Four: Get the route layer item onto your driver's mobile device.
  • Copy and paste the URL from your browser and email or text it to your driver. An example would be this public route item.

  • Alternatively, share your dedicated route group with your drivers. They can go to this group every day to see their updated route plans. For an example, see this public group.
Step Five: Open the link using a mobile device. Note that you must have Navigator installed and a map of the area downloaded, showing your stops. The map must be opened in Navigator. Enjoy!
Additional Information to Keep in Mind
  • Any route layer item created before the September 21, 2017, release of ArcGIS Online will not contain the Navigator app link within it. If you want to add the Navigator link to an existing route layer item, you can edit the route using the Directions pane and resave it. To do this, add the route layer to the Map Viewer, choose Edit Route, then resave the route.

  • Editing a route layer using the Directions pane and then saving it with the same name will overwrite the route layer, including any existing Navigator link. So, if your fieldworkers already have the URL to the route layer on their devices, you do not have to resend the route layer for them to see the updated route.
  • Using the analysis tools Find NearestPlan Routes, and Connect Origins to Destinations will always create new route layers, even when you rerun the analysis. In this case, a new link would need to be sent to the fieldworkers. Also, when running the analysis tools, be sure to check the option Include route layers; otherwise, the output will only be a feature service and will not include route layers.
  • If the route layer is not shared with the public, fieldworkers will need to sign in to ArcGIS Online when accessing the route layer on their mobile device.
  • Navigator for ArcGIS reads the stop list from the route layer. The route is still calculated by Navigator and can be slightly different (for example, total travel time or distance) compared to what was planned in the office.
  • In the future, Navigator for ArcGIS will be updated with a browsable experience so users can search and view routes that are shared with them and then download the routes locally into Navigator.

martes, 24 de octubre de 2017

Esri Apps Go on the Road with the Oklahoma Highway Patrol

Esri Apps Go on the Road with the Oklahoma Highway Patrol

Workforce for ArcGIS and ArcGIS Online Help the Agency Keep Motorists Safe and Fight Crime

By Carla Wheeler
ArcWatch Editor
The green icons on the map shows the positions of OHP troopers.
When the Oklahoma Highway Patrol (OHP) joined the search for a man suspected of killing a sheriff's deputy earlier this year, the law enforcement agency used Esri's ArcGIS Online and Workforce for ArcGIS to properly position more than 100 troopers as the dragnet tightened.
"We were able to keep track of all of [the troopers] with Workforce for ArcGIS," said Captain Ronnie Hampton, commander of the OHP's Futures, Capabilities, and Plans Division. Hampton spoke about his agency's use of Esri technology during the Esri National Security and Public Safety Summit, held last July in San Diego, California.
All 800 OHP troopers have downloaded the Workforce for ArcGIS mobile app onto their smartphones and enabled location tracking, giving dispatchers the ability to see each on-duty officer's GPS location on a customized Dispatch Map in ArcGIS Online. Workforce for ArcGIS is included at no extra cost in an ArcGIS Online subscription. The troopers, plus about 90 dispatchers, have ArcGIS Online accounts.
Hampton said that during the manhunt for the shooting suspect on April 18, 2017, incident commanders could see where each officer was stationed in real time on the map. That locational information helped the commanders decide where to place troopers that were needed for the operation while a search perimeter was set up. "We were able to send in over 100 troopers, sealing off a two-mile area," Hampton said. "We could see the boots on the ground." The Oklahoma County Sheriff's SWAT team captured the suspect several hours later that day.
Other types of organizations typically use Workforce for ArcGIS to create projects and assign them to staff in the field. Often, the projects involve service, maintenance, and inspection requests and follow-ups to sales leads.
But OHP leadership realized the app could provide a critical, real-time view of where all on-duty troopers are located as they patrol more than 111,000 miles of roads and highways, waterways, and the state capitol grounds. Knowing each trooper's position—which appears on the Dispatch Map as a green icon next to the officer's call number—gives communication center dispatchers the ability to instantly see where all the officers are stationed and, if possible, send the closest officer to the scene of an accident or other incident.
Until Workforce for ArcGIS was launched throughout the organization in the summer of 2016, dispatchers working in OHP's 13 communications centers were only responsible for dispatching troopers assigned to their specific district. For example, if a traffic collision occurred in the district covered by Troop A, only an officer from Troop A would be sent to the scene—even if an officer in Troop B was 20 miles closer.
Captain Ronnie Hampton has been helping to spearhead the use of GIS technology at the OHP.
"Prior to the [launch] of Workforce, [the dispatchers] would never have known that unit [in another district] was even working because they were focused on their own troop areas," Hampton said.
Now, dispatchers can summon anyone on staff—from a marine enforcement officer to OHP chief Ricky G. Adams—to respond to an incident based on their present location. "Our chief requires everybody, including himself, to use Workforce as they commute to work," Hampton said. "So, everyone in the entire agency is an assignable asset. [Adams] is very much a champion of technology and keeping people safer."
Last year, OHP conducted a 90-day test to find out how many hours and miles in travel time would be saved by using Workforce for ArcGIS to make dispatch decisions. In responding to 28 collisions and 23 cases where motorists needed assistance, the test showed a savings of 889 miles and 14 hours in travel time, Hampton said. "Mileage is a savings of fuel. Hours [saved mean] a quicker response for the public," he said.
The greatest benefit for Oklahomans is the faster response times, especially in rural areas, Hampton said. "The people that benefit from this are the public, by being able to have someone at the scene in 3 or 4 minutes versus . . . 45 or 50 minutes," he said. "That's where your hours of savings come in."
Following the test's success, OHP made Workforce for ArcGIS and ArcGIS Online available to all troopers last August. All officers downloaded the app onto their OHP-issued Samsung Galaxy S5 smartphones, via the Google Play store. (The app is also available from the Apple App Store and Amazon.)
Officers also can see the locations of their colleagues using a Trooper Map in their patrol cars.
Today, staff in all 13 communications centers use one comprehensive statewide Dispatch Map in ArcGIS Online to keep track of the officers' locations. The dispatchers can use the built-in Near Me widget to find the officer closest to the scene of an incident. They also can turn on layers in the map to obtain weather information; traffic conditions; and the locations and phone numbers of police, fire, and ambulance stations.
To create the Dispatch Map, the feature data service layer from Workforce for ArcGIS that contains the officers' locations and the green icons was added to ArcGIS Online. Widgets such as Near Me, Basemap Gallery, Filter, Legend, and Measurement were added using Web App Builder for ArcGIS. Weather data from the National Oceanographic and Atmospheric Administration (NOAA) also was brought in, along with traffic information from Esri's World Traffic Service. The GPS coordinates for police, fire, and ambulance agencies in Oklahoma and contact information, such as the phone numbers for each agency, were also added to the map.
Most of the information and capabilities in the Dispatch Map are available to on-duty officers using the Trooper Field Map in ArcGIS Online, accessible via computers mounted in their patrol cars. The troopers also have access to useful links on the toolbar, so they can retrieve information on court dates, for instance, for each of Oklahoma's 77 counties.
OHP also uses Esri Story Maps apps to tell stories about important issues such as motorcycle safety.
Troopers also can use tools in ArcGIS Online to set up buffer zones after an accident. For example, a trucker suffered a heart attack and crashed his vehicle into the beam of a highway underpass, causing a sulfuric acid spill, Hampton said. An OHP lieutenant on the scene used the Create Buffers tool to establish a zone with a half-mile radius around the incident. He then shared the map with colleagues so they could block off the area to traffic and onlookers.
Workforce for ArcGIS and ArcGIS Online also are providing situational awareness for OHP officers. During the pursuit of a suspect on a rural road, a trooper on duty 80 miles away, in another county, could see where the pursuing officer was located on the Trooper Field Map. When the trooper turned on satellite view, he noticed that the officer was coming up to a T-intersection and radioed him a warning to slow down. After the suspect veered off into a cow pasture, the trooper from the other county told the pursuing officers where there were openings in the pasture's fencing that they needed to blockade. "[The trooper] knew where the likely escape points were," said Hampton, adding, "We caught that guy."
Hampton said ArcGIS Online and Workforce for ArcGIS are being embraced in his department, especially by the younger officers who grew up with technology. "I've had other police agencies ask, 'How do your troopers feel about people being able to see [their location on a map]?' Some of our older troopers were resistant at first, but our younger troopers are super excited," Hampton said. "It used to be, we had to rely on that person who needed help to give out his physical location. Now, all he has to do is say, 'I need help,' and everybody can see where he's at."
OHP also is putting other Esri technology to good use for public safety, including Esri Story Maps apps. One story map created by the law enforcement agency showed where in Oklahoma motorcyclists had been killed or injured in 2015, and it presented statistics on how many of the riders killed or severely injured had been wearing helmets. Fifty-six percent of the people killed in 2015 in motorcycle accidents were not wearing helmets, according to the story map.
OHP plans to dispatch drones to capture imagery of traffic accident scenes, which would reduce the amount of time roads are closed due to investigations.
Story maps also may be used in the future to document homicide cases that stem from traffic collisions caused by people driving while intoxicated, Hampton said. "Fast-forward a year, and the [district attorney (DA)] may be in trial and has to explain to the jury what has happened," he said. "If we start collecting information from the time the 911 call comes in, and we document everything in story maps, then it's easier for our investigator to present a case to the DA with little to no effort because [all the information] is there. Then the DA can take…that [story] and present it to the jury."
In the coming months, OHP also plans to process imagery from some traffic collision scenes using Esri's Drone2Map for ArcGIS. Hampton said that OHP plans to initially acquire 13 drones to capture imagery of accidents that block busy roads. "We can't control cleanup, but we can control how much time we keep the road closed [while] doing the accident reconstruction," Hampton said. Rather than walking the scene and taking photos and measurements, the drone would take images of the accident aftermath. "With a drone, we can thoroughly document and collect video and photographs of a crash scene in about six minutes," he said.
OHP would use Drone2Map for ArcGIS to process the imagery and create products for use in investigations and, if necessary, court cases. "We can take a frame of a video and produce a two-dimensional picture. We can take still photography we shot with the drone and produce the two-dimensional picture," Hampton said. "If that case needs to go to court or if we want to revisit the scene the way we found it later, now we can watch the video of what we flew two years ago. If that case ends up being prosecutable, one of the things Drone2Map allows us to do is to create a 3D model. [You may] have seen these CSI [crime scene investigation] shows where they are walking a jury through an animation. Why animate something when you can actually take them back and let them fly through the scene?"